Many B2B content programs measure at the individual contact level: downloads, MQLs, email opens. The ‘Content Measurement Gap’ is the structural disconnect between these metrics and what pipeline actually requires. Complex B2B purchases involve 6-10 stakeholders. A single contact metric cannot represent a buying committee decision. Account-level attribution closes the gap.
B2B Content Performance Measurement: Why Engagement Metrics Cannot Answer the Pipeline Question
Demand
Nov 1, 2026

In This Article
- What Standard Content Metrics Actually Measure
- The Structural Problem with Contact-level Data
- The Three Metrics That Predict Pipeline
- Why Attribution Window Length Changes Everything
- Building Account-level Content Attribution: Four Steps
- The Reporting Shift That Changes Leadership Conversations
- What This Looks like Across Machintel Programs
- FAQs
The quarterly content review follows the same pattern across most B2B organizations. The content team presents the numbers. Traffic is up. Email open rates are strong. Gated assets are generating downloads above the benchmark.
Then the CFO asks: what percentage of pipeline this quarter came from or was influenced by content?
The honest answer is that only 54% of B2B SaaS marketers can tie content to pipeline. (Contentful and Benchmarker, 2026) The engagement data sits in one system. The pipeline data sits in another. The infrastructure connecting the two was never built.
This is the ‘Content Measurement Gap’. The content program is performing on every metric it reports. It cannot answer the question that justifies its budget.
What Standard Content Metrics Actually Measure
Standard B2B content performance metrics measure consumption. Traffic shows content is being found and downloads show it is being accessed. Social engagement signals it is resonating with an existing audience. Email open rates indicate the subject line worked.
None of these metrics tell you what happens after the content is consumed. They do not tell you if the person reading the piece is at a target account, in an active buying cycle, or a buying committee member whose engagement will eventually influence a purchase decision.
This is not a minor gap. In B2B, where complex purchase decisions involve 6-10 stakeholders (Demand Gen Report, 2023) and take months, the distance between content consumption and pipeline influence is where much content investment disappears without trace.
The programs that show strong pipeline contribution from content are not producing better content. They are measuring differently.
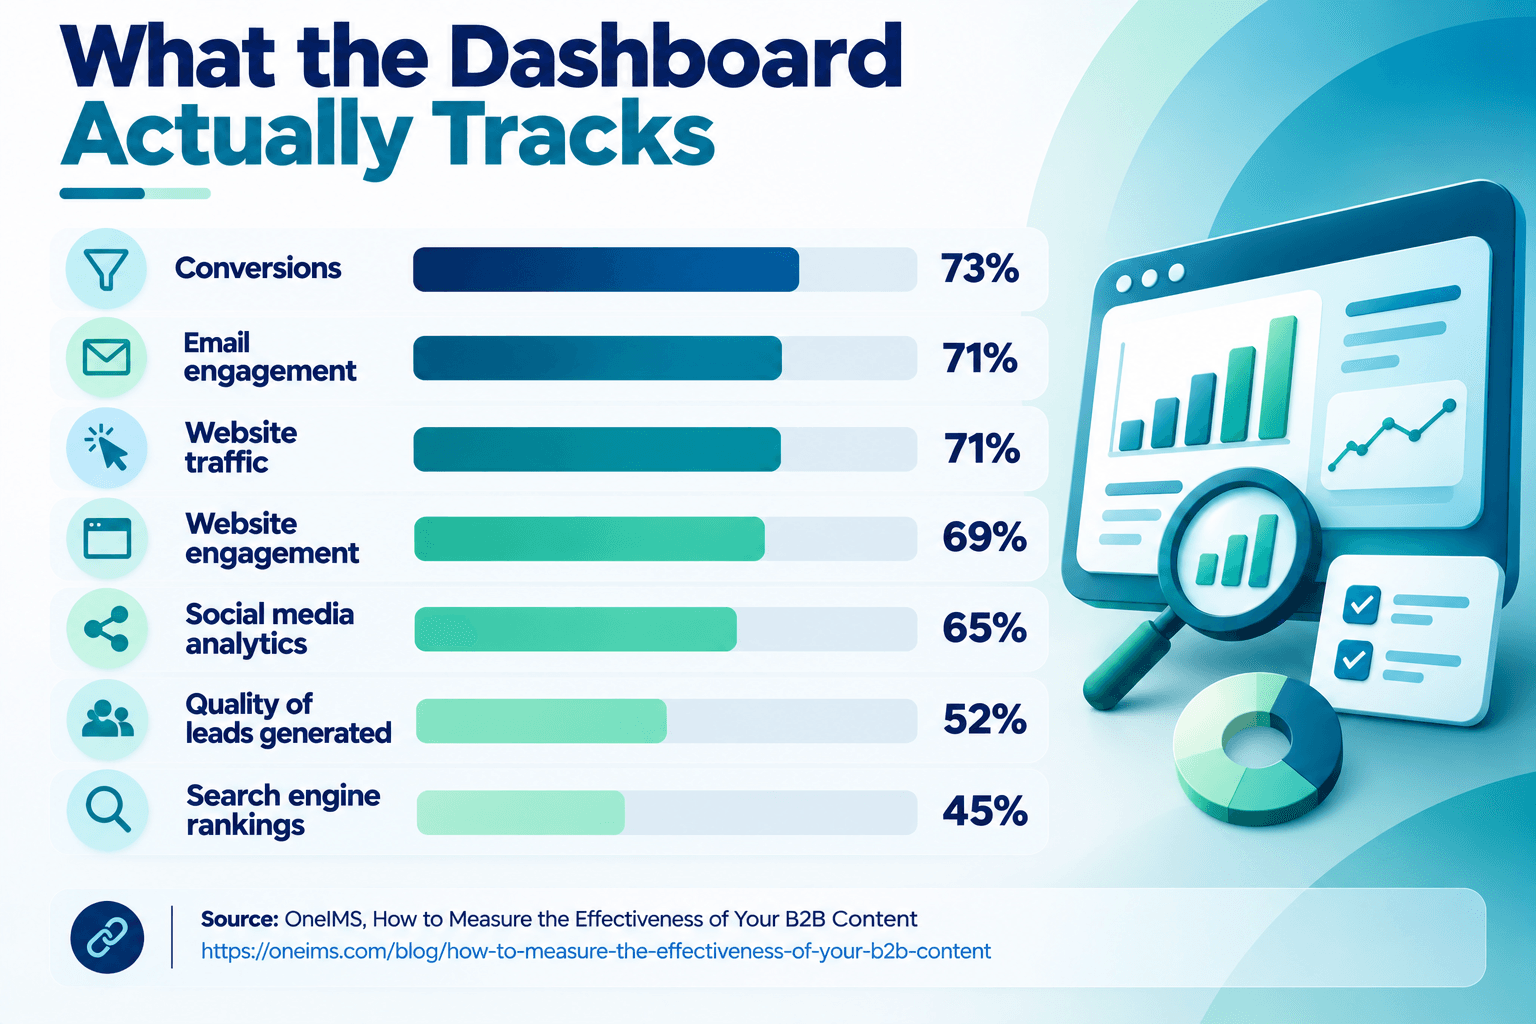
Presenting strong content numbers and then being asked what they mean for pipeline is an uncomfortable moment for any content team. Machintel’s demand generation team works with B2B marketers on that gap, planning programs around target accounts so results can be reported by account from day one. The next review can then answer the question that matters.
The Structural Problem with Contact-level Data
Most content measurement operates at the contact level. How many individuals downloaded this asset. How many contacts opened this email. How many people clicked this post.
B2B purchases are account-level events. A buying committee at one account makes a decision. Individual contact data, without account-level aggregation, produces a systematically distorted picture of how content contributes to that decision.
Consider two content programs with identical results: each generates 500 downloads from 500 different contacts.
Program A: The 500 downloads came from 500 different companies, most of which are not on the ICP target list.
Program B: The 500 downloads came from 3-5 contacts each at 140 target accounts, with concentrated buying committee engagement at accounts already showing intent signals.
Standard engagement reporting treats these programs as equivalent. They are not. Program B is generating the account-level concentration that precedes pipeline. Program A is generating volume.
Behavioral Cluster Intent data identifies which accounts have buying committee members actively consuming category-specific content, making it possible to distinguish between these two scenarios in real time rather than after the quarter closes.
The Three Metrics That Predict Pipeline
ICP Account Coverage Rate
What percentage of target accounts have had at least one buying committee member engage with content in the measurement period?
This metric answers the distribution question. A program with 2,400 engagements from 50 ICP accounts looks very different from a program with 2,400 engagements across 800 accounts, most of which are not ICP. Account coverage below 50% of the target account list after 90 days signals a reach problem. (Improvado, 2026)
Many content teams have never calculated this number. It requires contact-to-account mapping in CRM and target account list matching. When teams calculate it for the first time, the results are often sobering: content programs without active syndication can reach only a small share of their ICP target list.
Buying Committee Penetration Rate
Of the ICP accounts engaging with content, how many distinct buying committee members per account are engaging within a defined window?
This metric is a strong predictor of pipeline conversion. Accounts where three or more buying committee members have engaged with related content convert to pipeline at a higher rate than accounts with single-contact engagement.
Single-contact engagement at a target account is a weak signal. One person read something. Multi-contact engagement at the same account within a compressed window is a strong signal. Multiple stakeholders are engaged with the category at roughly the same time, suggesting active group consideration.
Standard content analytics cannot generate this metric. It requires contact data tied to account records and logic that aggregates individual engagement events into account-level penetration scores.
Content-influenced Pipeline Percentage
What percentage of pipeline opportunities had content engagement from at least one buying committee member in the 90 days before entering pipeline?
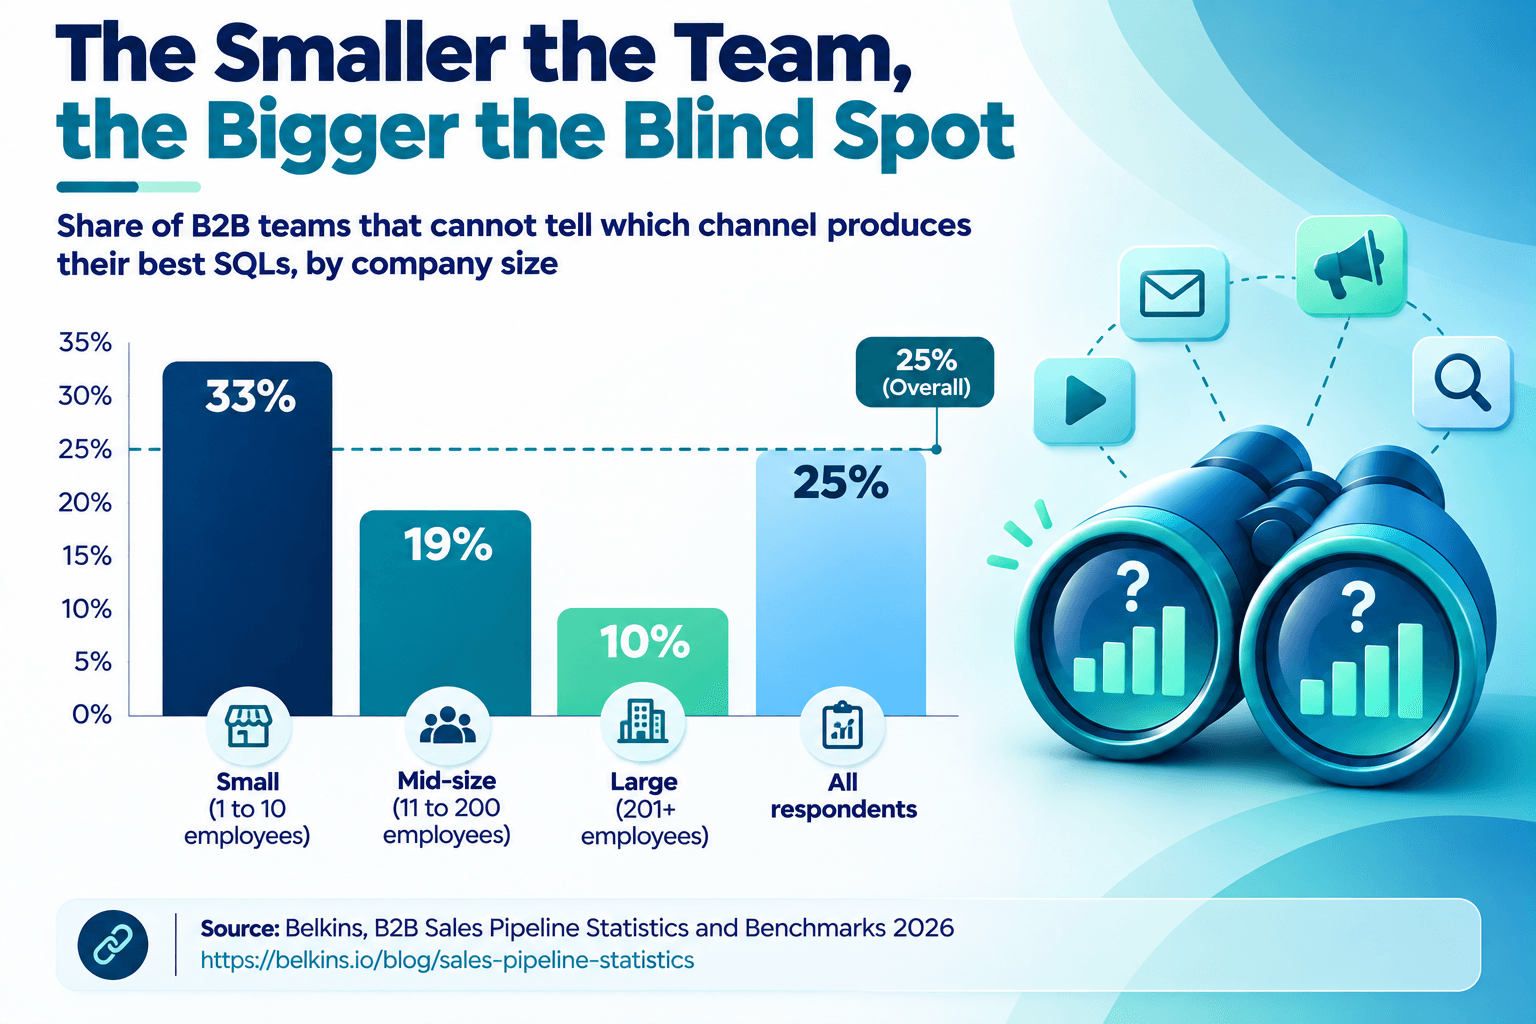
This is the metric that answers the CFO question directly. Programs with this measurement infrastructure typically show that 60-80% of pipeline opportunities had prior marketing engagement from at least one buyer in the account. (Demand Gen Insider citing Forrester, 2026) Programs that have never built account-level measurement miss much of it, not because the content is performing differently, but because 81% of the buyer journey happens outside the sales pipeline. (Dreamdata, 2026)
Why Attribution Window Length Changes Everything
The most underdiscussed variable in B2B content attribution is the measurement window.
Many content attribution models default to 30-day windows. The 30-day window persists because it matches the reporting calendar and makes the calculations simpler. It does not match how B2B buying decisions happen.
Programs using 90-day attribution windows typically show higher content-to-pipeline attribution than the same programs measured at 30 days. The content did not change. The window changed.
The explanation is clear. B2B buying cycles take months. A buyer researching a category problem in month one may not enter formal evaluation until month four. Content consumed during that early research phase influences the shortlist that forms much later. A 30-day attribution window is invisible to this influence. A 90-day window captures the research-phase engagement that actually shaped the consideration set.
The first time a team moves from 30-day to 90-day attribution, the content-influenced pipeline number drops before it rises. The 90-day window has not populated yet. This transition period is where most teams abandon the change. The teams that hold through it consistently find that the 90-day number is the accurate one.
Building Account-level Content Attribution: Four Steps
The infrastructure build is not technically complex. It is a data discipline problem that requires four components built in sequence:
Step 1 - Contact-to-account mapping in CRM: Every contact engaging with content needs an associated account record. This is standard CRM hygiene that is frequently incomplete. Contacts from content downloads, email clicks, and event registrations often exist in systems without account association. The mapping audit comes first. There is no account-level measurement without it.
Step 2 - Target account list integration: The contact-account data gets matched against the ICP target account list. Of all the contacts in the engagement database, which belong to accounts the program is trying to reach? This filter transforms an engagement report into a target account coverage report.
Step 3 - Engagement data linkage: Content engagement events need to be tied to contact identifiers that can be matched to CRM records. This requires UTM tracking on content links, form submissions that capture contact email addresses, or first-party identification through gated content. The goal: a traceable path from “this person read this content” to “this contact is in the CRM, at this account.”
Step 4 - Pipeline attribution logic: Define what counts as content-influenced (any engagement by a buying committee member within 90 days before pipeline entry), how the window is applied, and how the content-influenced pipeline percentage is calculated. Build this into the reporting cadence, not as a one-time analysis.
Total timeline: 5-7 months from decision to first reliable attribution data. The timeline is long because 90 days of post-build measurement is required before the attribution picture is meaningful.
The Reporting Shift That Changes Leadership Conversations
When content performance reporting moves from engagement metrics to account-level pipeline metrics, the conversation with revenue leadership changes.
Instead of: “Content drove 2,400 downloads and 18,000 sessions this quarter, with a 4.2% engagement rate.”
The report becomes: “Content reached 67 ICP accounts this quarter. Average buying committee penetration: 2.4 contacts per engaged account. 64% of new pipeline opportunities had content engagement from at least one buying committee member in the prior 90 days.”
The second report answers the CFO question. It also makes the case for distribution investment, because the connection between account coverage, buying committee penetration, and pipeline contribution is visible and quantifiable.
The content program does not need to be performing differently to generate this report. The measurement infrastructure needs to be in place. That is the investment most content budgets have not made.
What This Looks like Across Machintel Programs
Across 4,000+ B2B demand generation programs annually, Machintel has observed the same pattern: programs that start with account-level measurement infrastructure capture far more content-influenced pipeline within the first attribution window than programs that add measurement retrospectively.
The difference is not content quality. It is measurement timing. Early-stage engagement data that is not captured at the account level when it occurs is hard to reconstruct after the fact. The pipeline it influenced is largely invisible in the retrospective build.
Machintel content syndication programs produce account-level engagement data as standard campaign output: ICP account coverage, buying committee penetration by account, content-engaged contacts matched to pipeline records. The measurement infrastructure that most content teams spend months building after a program is live is part of how Machintel programs are designed before the first piece of content is distributed.
The ‘Content Measurement Gap’ is solvable because it is a data discipline problem, not a technology problem.
Account-level attribution is not a reporting improvement. It is a strategic reorientation.
Want to see what account-level attribution looks like in a live program? Talk to our team or explore our demand generation services.
FAQs
What is the most common reason B2B demand gen programs underperform?
The most common reason is a mismatch between the signal type purchased and the action it is supposed to trigger. Programs built on volume metrics, impressions, opens, clicks, cannot reliably identify accounts in active evaluation. The signal does not correlate to buying intent, so outreach volume rises while conversion rates fall.
How should a B2B marketing team measure demand gen program health before pipeline appears?
Track account coverage rate in your ICP segment, buying committee penetration rate, and stage progression velocity. These three metrics show whether the program is building toward pipeline without requiring closed revenue to validate early-stage activity.
What is the single most effective change a demand gen team can make to improve pipeline quality?
Shift from contact-level metrics to account-level metrics. A program that counts individual opens and clicks will optimize for volume. A program that measures account engagement across multiple contacts will optimize for buying committee coverage, which is what produces pipeline.