Demand Gen Metrics B2B: What to Measure Instead of MQL Volume

Demand
Sep 9, 2026
Demand Gen Metrics B2B What to Measure Instead of MQL Volume.png

Every demand gen team is measured on something. Most of them are measured on the wrong thing.

MQL volume is the dominant metric in B2B demand generation. It is also the metric that produces the most predictable breakdown in sales-marketing alignment. Marketing optimizes for it. Sales discounts it. Finance cannot connect it to revenue. The cycle repeats every quarter.

The fix is not a better MQL definition. It is a different measurement framework, built around three metrics that live in the CRM and can be verified by sales without a data request from marketing.

The Three CRM Metrics Model is Machintel’s framework for replacing MQL volume with three CRM-verified metrics: account-stage progression, 90-day pipeline contribution, and sales follow-up rate. See how it works.

MQL volume measures marketing activity, not sales outcome. Three CRM metrics replace it: account-stage progression (which ICP accounts moved through pipeline stages), 90-day pipeline contribution per program (which programs have CRM opportunity records), and sales follow-up rate (the leading indicator of definition quality). All three are verifiable by sales without a data request from marketing.

Why MQL Volume Fails as a Primary Metric

The MQL was designed to identify contacts ready for sales engagement. The intent was sound. What happened in practice is that it became a volume target.

When marketing teams are measured on MQL count, every program decision optimizes for more contacts. Higher-volume sources get funded. Quality signals that would reduce volume get deprioritized. The result: more contacts, lower conversion rates, and a sales team that stops trusting the metric.

‘The Metric Replacement Gap’ is what follows: every senior demand gen leader knows the MQL is broken. Few have replaced it with something sales, finance, and marketing will all accept. The gap is not awareness. It is the absence of a replacement framework that survives the quarterly review.

At Forrester’s B2B Summit North America 2026, MQLs were challenged as an insufficient proxy for revenue confidence, even where teams still report them. Stronger measures included opportunities created, opportunities accepted by sales, stage progression, pipeline value, account quality, and business outcome alignment. The change was not about better contacts in isolation. It came from changing what the team optimized toward.

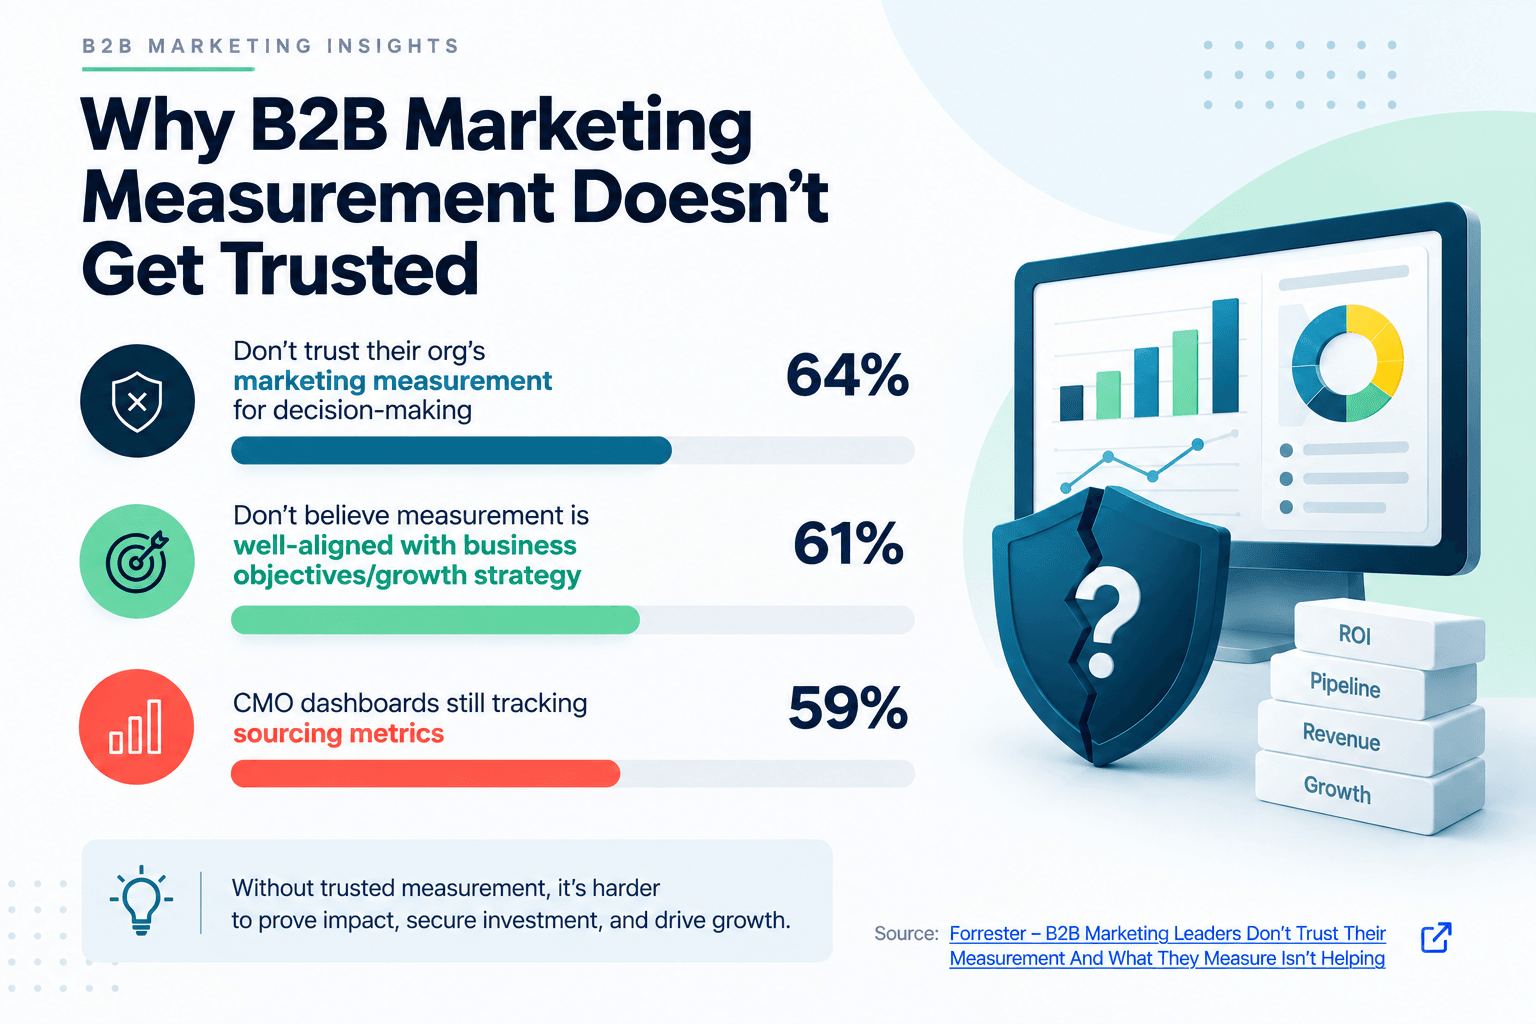
The current state of most B2B demand gen programs reflects this measurement gap in a different form. Only 28% of marketing professionals consider their attribution strategy very successful in achieving strategic objectives, while 66% call it only somewhat successful (Ascend2, 2024 Marketing Attribution Survey). Attribution and lead-stage metrics are different problems, but they share the same root cause: teams are still measuring what’s easy to count rather than what connects to revenue. When the primary metric does not connect to revenue, neither does the budget justification.

The Structural Problem with Contact-level Metrics

Contact-level metrics measure what marketing touches. Pipeline-level metrics measure what marketing moves.

Both measure real activity. Only one answers the question sales and finance are asking.

A contact who downloads a gated asset is measurable. Whether that contact belongs to an ICP account, whether the account is in active evaluation, and whether the download will lead to a conversation that converts to opportunity: none of those questions are answered by the contact record.

MQL optimization produces better contacts within the contact-level frame. It cannot change what the metric fundamentally measures.

Organizations using buying-group-level engagement metrics report 2 to 3x higher win rates than those relying on lead-centric targeting (Demandbase, State of ABM 2026 Benchmark Report). The mechanism is direct. Account-level measurement rewards programs that engage the right accounts. Volume programs that generate contacts from outside the ICP do not improve the metric. Budget shifts accordingly.

Machintel runs 4,000+ campaigns annually. The pattern is consistent: programs that generate the highest MQL volume are frequently not the same programs producing the most pipeline. Measurement determines investment. If the measurement is wrong, the investment is wrong.

Demand Gen Metrics B2B_infographics.png

The Scene That Changes the Framework

Consider a Demand Gen Director who rebuilds the reporting framework after a failed budget review.

The previous framework was built around MQL counts, source breakdown, and cost per MQL. The budget review produced questions from sales and finance that marketing could not answer with that data. Which programs produced pipeline? Which channels drove closed-won? What percentage of passed contacts did sales actually work?

The new framework uses three metrics:

Account-stage progression: Which named ICP accounts moved through defined pipeline stages in the last 90 days?

90-day pipeline contribution: Which programs have CRM opportunity records attached to them?

Sales follow-up rate: What percentage of passed contacts did sales engage within 5 days?

First quarter results: MQL volume down 35%. Pipeline contribution up 60%. Sales follow-up rate from 41% to 74%.

The next budget review is a different meeting. Not because the story is better. Because the data is in a system finance already trusts, and sales can verify every number without asking marketing to run a custom report.

Metric 1: Account-stage Progression

Account-stage progression measures which named accounts from the ICP target list moved through defined pipeline stages in the reporting period.

This metric starts with account selection. The ICP target list is the denominator. The numerator is ICP accounts that moved from one pipeline stage to the next. The measurement is movement on the right accounts, not volume across all contacts.

The 90-day window matters. Account-stage progression over 90 days captures enough of the buying cycle to reflect program impact while remaining actionable in quarterly planning.

Companies that coordinate SDR and marketing activity on shared named accounts see a separate lift from this coordination specifically: 40% higher engagement rates and 28% higher win rates (Forrester research, cited via Landbase, 2026). When programs are optimized toward ICP account movement, SDR queues contain contacts from accounts that are actually in scope. Time spent on qualification drops. Time spent on active opportunities increases.

For implementation, the requirement is an ICP account list in the CRM with defined stage designations. Most enterprise CRMs support account-level pipeline stages natively. The configuration step is ensuring marketing campaign touches are associated with account records, rather than contact records alone.

Metric 2: 90-day Pipeline Contribution per Program

Pipeline contribution per program answers one question: which of our demand gen programs have opportunity records attached to them in the CRM?

This is attribution at the program level, measured against pipeline records. Not impressions, not clicks, not MQL count. Opportunity records, by program, over 90 days.

The 90-day window is the recommended standard for defining marketing-influenced pipeline: tight enough to represent genuine mid-funnel contribution, loose enough to capture realistic B2B buying journeys (Rework). It captures enough of the buying cycle to show program influence on pipeline creation while remaining short enough to inform quarterly planning cycles.

Companies that align sales and marketing around shared CRM data see this play out directly. Smartsheet reported a 26% improvement in opportunity rates after aligning campaign targeting with shared account data (ZoomInfo). The alignment improvement comes from a shared data source. Both teams can pull the same CRM report. Marketing cannot report a program as top-performing if the CRM data shows no opportunity records attached to it.

Companies using pipeline attribution that adopt multi-touch models generate 15-20% more pipeline from the same budget compared to single-touch attribution (Rework). The gain is reallocation. Programs with high opportunity attachment receive more investment. Programs with high contact volume but no pipeline contribution are reviewed and redirected.

Metric 3: Sales Follow-up Rate

Sales follow-up rate is the percentage of marketing-passed contacts that sales engaged within 5 days.

This metric is the most direct measure of if the demand gen definition is working. Sales follow-up behavior is an honest signal. When contacts are worth calling, sales calls them. When contacts are not worth calling, sales deprioritizes them regardless of what marketing reports about quality.

Based on Machintel’s benchmark data across 4,000+ campaigns annually, there are two thresholds:

Above 70%: The definition is working. Sales trusts the quality and the volume. The contacts are from ICP accounts with sufficient intent signals to merit engagement.

Below 50%: The definition needs a rebuild. Sales is not engaging because the contacts are not meeting their quality threshold. Adjusting MQL scoring will not fix this. The programs generating the contacts need to change.

Tracking this metric requires a timestamp on the handoff and a logged first sales activity date in the CRM. Most CRM systems can generate this report natively. The barrier is usually that marketing has not asked for the data, not that it is unavailable.

Why All Three Metrics Must Live in the CRM

The three-metric framework only works if all three metrics are accessible from the CRM without a data request from marketing.

If marketing controls the reporting and sales has to ask for the data, the alignment problem is structural. Sales will discount the data because it comes from a system they do not control and cannot verify.

When account-stage progression, pipeline contribution, and follow-up rate all live in the CRM:

Sales can pull the data themselves. There is no version of the truth that only marketing can see.

Finance can audit the numbers. The pipeline data is in the same system they use to forecast revenue.

Budget conversations are data exercises, not negotiations. The allocation follows the evidence.

Data that sales leadership cannot independently verify is data they have little reason to trust. Moving the metrics to the CRM is what makes that data trustworthy.

Wrap Up

The demand gen teams with the most difficult budget conversations are the ones bringing MQL counts to meetings where finance and sales are asking about pipeline.

The teams that have shifted to the three-metric framework arrive at the quarterly review with account-stage movement, program-level pipeline attribution, and a follow-up rate that shows sales trusts the quality. Numbers finance can evaluate. Numbers sales can verify. A demand gen budget that is easier to defend than it has ever been.

The measurement framework is not a reporting choice. It is the thing that determines if the budget conversation is about volume or about revenue.

Running a demand gen program that isn’t producing pipeline? Machintel runs 4,000+ campaigns annually. Talk to us about your qualification model.

FAQs

What is the most common reason B2B demand gen programs underperform?
The most common reason is a mismatch between the signal type purchased and the action it is supposed to trigger. Programs built on volume metrics cannot reliably identify accounts in active evaluation, so outreach volume rises while conversion rates fall.

How should a B2B marketing team measure demand gen program health before pipeline appears?
Track account coverage rate in your ICP segment, buying committee engagement depth, and stage progression velocity. These metrics show whether the program is building toward pipeline without requiring closed revenue to validate early-stage activity.

What is the single most effective change a demand gen team can make to improve pipeline quality?
Shift from contact-level metrics to account-level metrics. A program that counts individual opens and clicks will optimize for volume. A program that measures account engagement across multiple contacts will optimize for buying committee coverage, which is what produces pipeline.

Machintel runs 4,000+ campaigns annually. The sales follow-up rate threshold referenced in this blog (above 70% healthy, below 50% rebuild needed) is derived from Machintel’s internal benchmark data across those programs.